Will The 1992 So Cal Recession Be Repeated? 
                                                                   
                                                                     Created : June 13, 2005
       << Back Home                                    *** Last Updated : Feb 24, 2009

            Most of us do not remember the Last Recession resulting from a Real Estate Bubble
       Bust. I have pulled out historical data from OFHEO's website about Southern California
       Home Price Appreciation Rates.

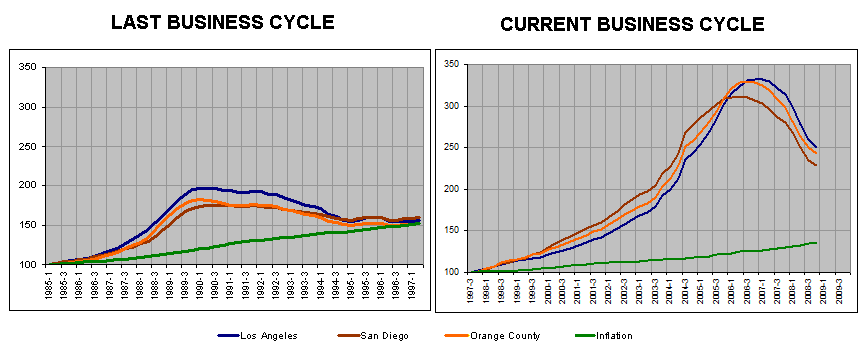
            How a $100 grew as investment in a Southern California home, and also adjusted
       for inflation. By the end of the last cycle, home investment had barely beaten inflation.

            Notice the stark Similarity Between The Last and The Current Business Cycle.
       But this time the expansion / appreciation has gone for much longer than the previous
       cycle. The resulting recession will also be equally long and painful.


           Northern California : San Francisco Bay Area Mega Bubble Appreciation Rates

              
Last Business Cycle
Year-Q Rates Values
Los
Angeles
San
Diego
Orange
County
Infl. Los
Angeles
San
Diego
Orange
County
Infl.
1985-1 3.57 3.82 2.99 3.58 100.00 100.00 100.00 100.00
1985-2 5.03 4.77 2.83 3.74 101.49 101.74 100.49 100.93
1985-3 6.15 5.89 3.33 3.35 103.82 103.90 102.24 101.78
1985-4 6.90 4.57 4.14 3.51 105.22 103.94 103.11 102.67
1986-1 6.23 6.24 4.30 3.09 106.23 106.24 104.30 103.46
1986-2 6.75 5.93 5.34 1.62 108.34 107.78 105.87 103.88
1986-3 7.02 6.16 5.41 1.63 111.11 110.30 107.78 104.30
1986-4 8.47 7.86 7.26 1.28 114.14 112.12 110.61 104.64
1987-1 11.19 8.02 8.58 2.2 118.12 114.77 113.25 105.21
1987-2 12.29 8.78 9.95 3.76 121.67 117.25 116.40 106.20
1987-3 14.07 8.86 12.10 4.19 126.75 120.08 120.82 107.31
1987-4 15.60 9.59 12.87 4.5 131.96 122.88 124.84 108.52
1988-1 16.88 10.18 14.33 3.97 138.07 126.45 129.49 109.60
1988-2 19.02 11.17 16.61 3.92 144.81 130.35 135.74 110.67
1988-3 20.82 13.35 20.12 4.11 153.14 136.12 145.14 111.81
1988-4 23.59 17.62 25.24 4.31 163.09 144.54 156.35 113.02
1989-1 24.28 20.16 26.64 4.83 171.60 151.95 164.00 114.38
1989-2 24.94 22.49 26.62 5.22 180.94 159.67 171.89 115.87
1989-3 24.19 23.13 22.84 4.68 190.20 167.61 178.30 117.23
1989-4 19.97 19.23 16.06 4.6 195.68 172.35 181.47 118.58
1990-1 15.03 14.61 11.15 5.23 197.40 174.16 182.30 120.13
1990-2 9.04 9.34 5.39 4.58 197.31 174.60 181.16 121.50
1990-3 3.76 5.35 1.07 5.53 197.37 176.59 180.21 123.18
1990-4 -0.50 1.46 -1.91 6.22 194.70 174.86 178.00 125.10
1991-1 -1.44 0.50 -3.19 5.29 194.54 175.04 176.48 126.75
1991-2 -2.65 -0.42 -3.12 4.85 192.07 173.86 175.50 128.29
1991-3 -2.89 -1.62 -2.37 3.88 191.65 173.72 175.92 129.53
1991-4 -0.55 -0.08 -0.31 2.99 193.62 174.72 177.44 130.50
1992-1 -0.97 -0.51 -0.15 2.87 192.64 174.14 176.20 131.44
1992-2 -1.01 -0.66 -0.51 3.1 190.13 172.71 174.59 132.46
1992-3 -1.54 -0.79 -1.21 3.1 188.70 172.33 173.78 133.48
1992-4 -3.86 -2.20 -3.52 3.05 186.13 170.87 171.18 134.50
1993-1 -5.58 -3.08 -4.33 3.2 181.89 168.76 168.57 135.58
1993-2 -5.89 -3.15 -4.74 3.15 178.92 167.27 166.32 136.65
1993-3 -6.73 -3.71 -5.59 2.75 176.00 165.93 164.06 137.59
1993-4 -6.59 -3.11 -5.26 2.73 173.85 165.55 162.16 138.52
1994-1 -5.69 -2.77 -5.07 2.52 171.53 164.07 160.03 139.40
1994-2 -8.20 -3.83 -6.19 2.38 164.24 160.85 156.01 140.23
1994-3 -8.62 -4.00 -6.13 2.88 160.81 159.29 153.99 141.24
1994-4 -9.60 -4.75 -6.61 2.65 157.16 157.67 151.43 142.17
1995-1 -9.37 -4.14 -5.96 2.84 155.45 157.28 150.49 143.18
1995-2 -4.35 -1.52 -2.72 3.09 157.09 158.40 151.75 144.29
1995-3 -0.68 0.33 -1.14 2.64 159.70 159.83 152.23 145.24
1995-4 1.94 1.30 0.66 2.65 160.22 159.73 152.44 146.20
1996-1 2.86 1.69 1.19 2.74 159.89 159.94 152.28 147.20
1996-2 -0.72 -0.66 -0.86 2.85 155.96 157.34 150.44 148.25
1996-3 -3.01 -1.69 -1.22 2.94 154.89 157.12 150.37 149.34
1996-4 -2.59 -0.65 -0.70 3.19 156.07 158.68 151.37 150.53
1997-1 -2.23 -0.63 -0.35 2.94 156.32 158.91 151.73 151.64
1997-2 0.38 2.02 1.44 2.34 156.56 160.53 152.61 152.53

              
Current Business Cycle
Year-Q Rates Values
Los
Angeles
San
Diego
Orange
County
Infl. Los
Angeles
San
Diego
Orange
County
Infl.
1997-3 3.28 4.20 3.54 2.2 100.00 100.00 100.00 100.00
1997-4 5.00 4.71 4.61 1.87 102.44 101.49 101.71 100.46
1998-1 7.51 7.14 7.11 1.46 105.06 103.99 104.38 100.83
1998-2 9.69 9.08 9.73 1.6 107.35 106.95 107.55 101.23
1998-3 10.13 10.48 11.42 1.6 110.13 110.49 111.42 101.64
1998-4 10.01 11.19 12.25 1.55 112.70 112.85 114.18 102.03
1999-1 8.92 10.54 11.27 1.67 114.44 114.96 116.16 102.46
1999-2 7.71 9.72 10.16 2.11 115.63 117.35 118.49 103.00
1999-3 6.42 9.66 8.91 2.34 117.21 121.17 121.36 103.60
1999-4 5.61 10.30 7.99 2.62 119.02 124.48 123.31 104.28
2000-1 7.02 13.82 10.24 3.24 122.47 130.86 128.06 105.12
2000-2 7.15 14.74 10.48 3.33 123.91 134.66 130.91 106.00
2000-3 8.10 14.99 10.73 3.51 126.71 139.34 134.39 106.93
2000-4 8.89 15.42 11.90 3.43 129.61 143.69 137.99 107.85
2001-1 8.85 13.46 10.36 3.39 133.32 148.48 141.33 108.76
2001-2 9.98 13.31 10.86 3.38 136.28 152.59 145.13 109.68
2001-3 9.96 12.64 11.03 2.7 139.34 156.97 149.22 110.42
2001-4 10.01 11.79 10.33 1.86 142.60 160.64 152.25 110.93
2002-1 10.51 11.94 11.17 1.25 147.34 166.22 157.12 111.28
2002-2 12.37 13.97 12.83 1.3 153.15 173.92 163.75 111.64
2002-3 14.14 15.98 13.96 1.59 159.06 182.06 170.06 112.09
2002-4 15.12 17.20 14.98 2.2 164.16 188.28 175.06 112.70
2003-1 14.44 16.67 14.46 2.87 168.63 193.95 179.85 113.51
2003-2 12.79 14.05 12.33 2.13 172.75 198.36 183.95 114.11
2003-3 13.06 12.86 12.23 2.2 179.83 205.48 190.87 114.74
2003-4 17.75 16.69 17.01 1.9 193.31 219.71 204.85 115.29
2004-1 19.37 17.78 18.88 1.79 201.31 228.44 213.82 115.80
2004-2 24.11 22.65 24.44 2.87 214.42 243.30 228.92 116.63
2004-3 31.63 31.35 32.59 2.73 236.72 269.92 253.08 117.43
2004-4 26.84 26.68 27.14 3.32 245.21 278.34 260.47 118.41
2005-1 26.82 25.79 25.47 3.04 255.32 287.37 268.29 119.31
2005-2 25.82 21.20 23.48 2.95 269.80 294.89 282.68 120.19
2005-3 20.14 11.94 16.76 3.83 284.40 302.17 295.51 121.34
2005-4 23.38 10.87 19.11 3.74 302.54 308.61 310.25 122.47
2006-1 23.19 7.75 19.65 3.75 314.55 309.66 321.04 123.62
2006-2 19.49 4.69 15.15 4.01 322.39 308.73 325.52 124.86
2006-3 15.33 1.86 10.14 3.34 328.02 307.82 325.49 125.90
2006-4 8.86 -1.15 4.62 1.94 329.35 305.04 324.61 126.51
2007-1 4.43 -2.87 -0.06 2.43 328.48 300.75 320.82 127.28
2007-2 1.46 -4.35 -2.74 2.65 327.12 295.28 316.57 128.12
2007-3 -1.98 -7.06 -5.55 2.36 321.50 286.07 307.41 128.88
2007-4 -4.88 -8.38 -8.23 3.98 313.26 279.47 297.89 130.16
2008-1 -8.99 -10.73 -12.17 4.11 298.94 268.45 281.76 131.50
2008-2 -14.95 -15.23 -16.75 4.38 278.20 250.30 263.54 132.94
2008-3 -19.00 -18.03 -18.36 5.3 260.39 234.48 250.94 134.70
2008-4 -19.76 -18.02 -18.21 1.61 251.33 229.08 243.62 135.24
2009-1 ? ? ? ? ? ? ? ?
2009-2 ? ? ? ? ? ? ? ?
2009-3 ? ? ? ? ? ? ? ?
2009-4 ? ? ? ? ? ? ? ?


                        Color Scheme 

 New Business Cycle, Appreciation Equals Inflation. 

 Appreciation Greater Than Inflation, under 10%. 

 Runaway Appreciation, Foundation of The Bubble, between 10% and 20%.

 Bubble's Peak, over 20%. 

 Market Stalling, Plateau, Year-Over-Year Appreciation Stops. 

 Year-Over-Year Appreciation approaches 0%. 

 Bubble Busted, Recession, -ve appreciation.  

 Recovery , +ve appreciation again.
______________________________________________________________________________

   Copyright © 2005 by Author. This material may be distributed only subject
   to the terms and conditions set forth in the Open Publication License.