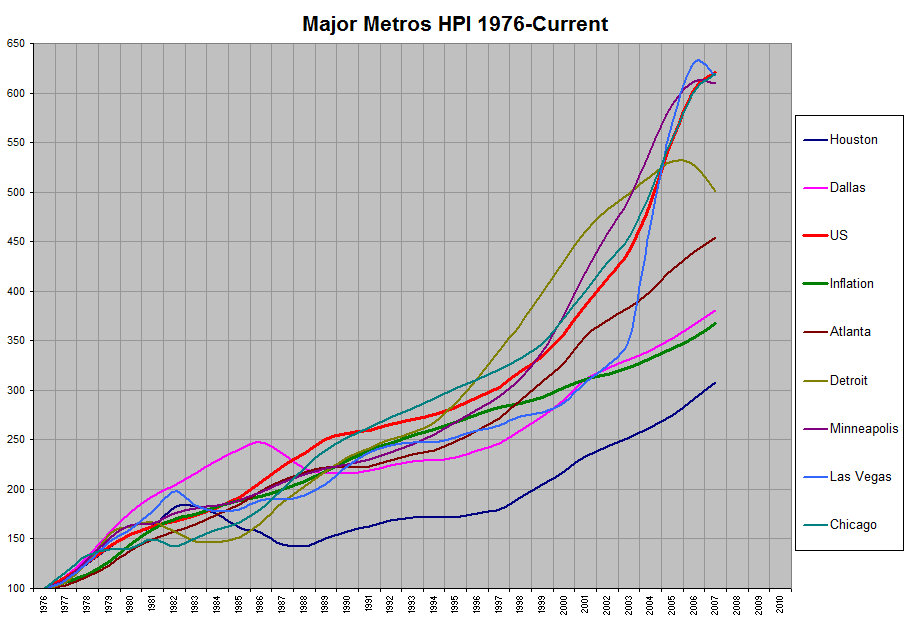
Major Metros Appreciation Graphs

<< Back Home                                            Created : Jan 4, 2006
                                                     *** Last Updated : Feb 26, 2008


The Graphs start at an assumed HPI of 100 in 1976 for all.

Yearly (X-axis) HPI Data (Y-axis) Obtained from OFHEO.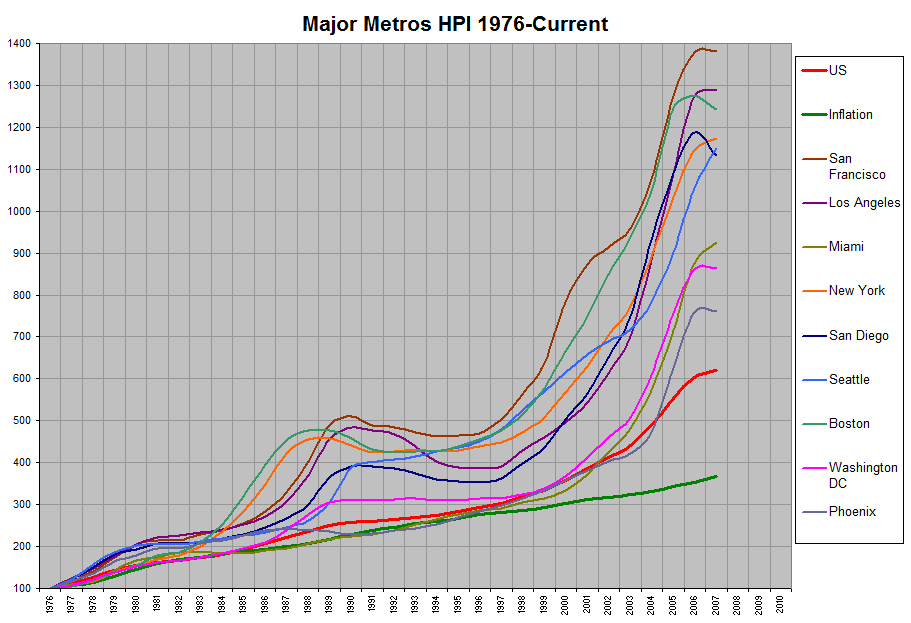
 ______________________________________________________________________________

Copyright © 2005 by Author. This material may be distributed only subject
to the terms and conditions set forth in the Open Publication License.