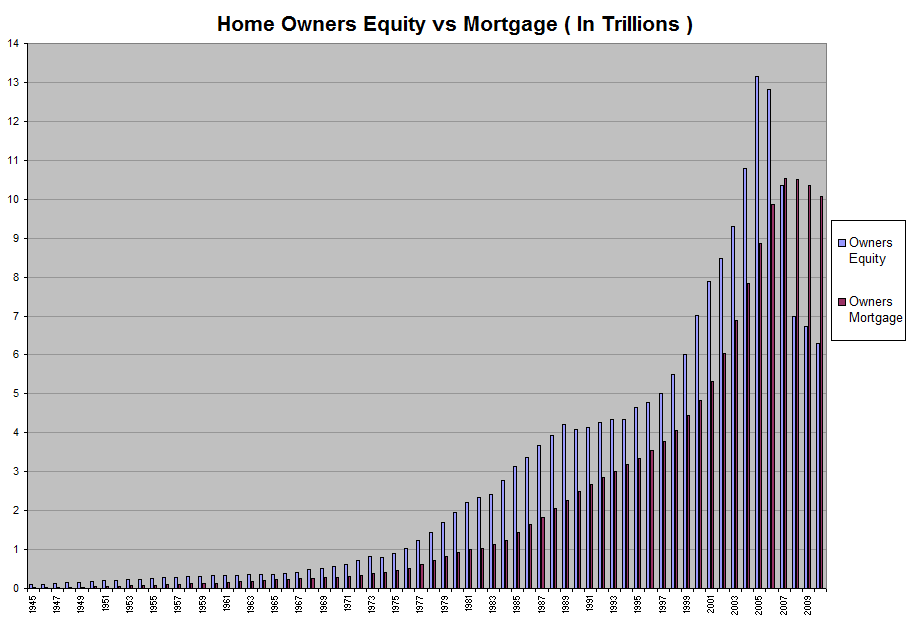
| Year |
Equity |
Mortgage |
| Billions |
Percent |
Billions |
Percent |
| 1945 |
97.5 |
84.0 |
18.6 |
16.0 |
| 1946 |
110.5 |
82.8 |
23.0 |
17.2 |
| 1947 |
130.8 |
82.3 |
28.1 |
17.7 |
| 1948 |
146.9 |
81.6 |
33.1 |
18.4 |
| 1949 |
159.5 |
81.0 |
37.4 |
19.0 |
| 1950 |
177.5 |
79.8 |
45.0 |
20.2 |
| 1951 |
197.7 |
79.4 |
51.4 |
20.6 |
| 1952 |
214.6 |
78.7 |
58.2 |
21.3 |
| 1953 |
227.4 |
77.6 |
65.7 |
22.4 |
| 1954 |
240.3 |
76.2 |
75.0 |
23.8 |
| 1955 |
257.1 |
74.6 |
87.5 |
25.4 |
| 1956 |
273.1 |
73.5 |
98.3 |
26.6 |
| 1957 |
287.4 |
72.9 |
107.0 |
27.1 |
| 1958 |
299.1 |
71.9 |
116.8 |
28.1 |
| 1959 |
311.5 |
70.6 |
129.6 |
29.4 |
| 1960 |
323.6 |
69.7 |
140.8 |
30.3 |
| 1961 |
335.3 |
68.6 |
153.3 |
31.4 |
| 1962 |
343.3 |
67.2 |
167.5 |
32.8 |
| 1963 |
347.2 |
65.4 |
184.1 |
34.6 |
| 1964 |
355.6 |
63.8 |
201.4 |
36.2 |
| 1965 |
363.7 |
62.5 |
218.6 |
37.5 |
| 1966 |
392.6 |
62.9 |
231.9 |
37.1 |
| 1967 |
415.1 |
62.9 |
245.1 |
37.1 |
| 1968 |
478.6 |
64.6 |
262.2 |
35.4 |
| 1969 |
526.0 |
65.4 |
278.3 |
34.6 |
|
| Year |
Equity |
Mortgage |
| Billions |
Percent |
Billions |
Percent |
| 1970 |
558.9 |
66.1 |
286.7 |
33.9 |
| 1971 |
615.3 |
66.5 |
310.5 |
33.5 |
| 1972 |
719.3 |
67.6 |
345.4 |
32.4 |
| 1973 |
828.8 |
68.3 |
385.1 |
31.7 |
| 1974 |
797.3 |
65.4 |
422.0 |
34.6 |
| 1975 |
908.1 |
66.3 |
461.0 |
33.7 |
| 1976 |
1022.9 |
66.4 |
518.7 |
33.6 |
| 1977 |
1227.4 |
67.0 |
604.6 |
33.0 |
| 1978 |
1439.0 |
66.9 |
710.5 |
33.1 |
| 1979 |
1706.5 |
67.3 |
827.6 |
32.7 |
| 1980 |
1939.6 |
67.6 |
927.6 |
32.4 |
| 1981 |
2214.9 |
68.9 |
999.0 |
31.1 |
| 1982 |
2335.2 |
69.4 |
1032.0 |
30.6 |
| 1983 |
2404.5 |
68.3 |
1117.6 |
31.7 |
| 1984 |
2783.3 |
69.1 |
1244.0 |
30.9 |
| 1985 |
3129.7 |
68.4 |
1444.3 |
31.6 |
| 1986 |
3358.9 |
67.2 |
1642.1 |
32.8 |
| 1987 |
3679.9 |
66.9 |
1821.2 |
33.1 |
| 1988 |
3930.0 |
65.8 |
2046.2 |
34.2 |
| 1989 |
4204.0 |
64.9 |
2269.9 |
35.1 |
| 1990 |
4076.0 |
62.0 |
2500.0 |
38.0 |
| 1991 |
4130.4 |
60.7 |
2679.2 |
39.3 |
| 1992 |
4269.1 |
59.9 |
2853.0 |
40.1 |
| 1993 |
4345.2 |
59.1 |
3012.6 |
40.8 |
| 1994 |
4341.7 |
57.7 |
3181.5 |
42.3 |
|
| Year |
Equity |
Mortgage |
| Billions |
Percent |
Billions |
Percent |
| 1995 |
4651.3 |
58.2 |
3338.8 |
41.8 |
| 1996 |
4771.7 |
57.3 |
3548.9 |
42.7 |
| 1997 |
5007.5 |
57.0 |
3772.3 |
43.0 |
| 1998 |
5469.1 |
57.3 |
4076.5 |
42.7 |
| 1999 |
5944.9 |
57.2 |
4450.7 |
42.8 |
| 2000 |
6583.9 |
57.7 |
4817.3 |
42.3 |
| 2001 |
7209.7 |
57.7 |
5281.8 |
42.3 |
| 2002 |
7762.5 |
56.7 |
5917.3 |
43.3 |
| 2003 |
8426.5 |
55.9 |
6658.3 |
44.1 |
| 2004 |
9691.6 |
56.2 |
7551.7 |
43.8 |
| 2005 |
10519.6 |
54.3 |
8883.2 |
45.7 |
| 2006 |
10945.2 |
53.0 |
9675.7 |
47.0 |
| 2007 |
- |
- |
- |
- |
| 2008 |
- |
- |
- |
- |
| 2009 |
- |
- |
- |
- |
| 2010 |
- |
- |
- |
- |
| 2011 |
- |
- |
- |
- |
| 2012 |
- |
- |
- |
- |
| 2013 |
- |
- |
- |
- |
| 2014 |
- |
- |
- |
- |
| 2015 |
- |
- |
- |
- |
| 2016 |
- |
- |
- |
- |
| 2017 |
- |
- |
- |
- |
| 2018 |
- |
- |
- |
- |
| 2019 |
- |
- |
- |
- |
|